This web page was produced as an assignment for Genetics 564, an undergraduate course at UW-Madison.
Protein Phylogeny
|
Phylogeny refers to the relationships between species. These relationships are then used to create phylogenetic trees, which show the genetic (or in this case protein) connections and relationships between species through branches. In the past, these trees were based off of the similarity seen between physical features, such as size, color, and number of limbs. Due to the advancement of modern technology, trees are now created based on the similarity between genetic and protein sequences between species. Thus, this technique relies greatly on the study of homology as well [1]. These trees show the evolutionary history of life as the species diverge from a universal common ancestor.
|
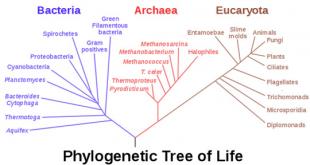
A simple example of a phylogenetic tree of life (click to enlarge)
|
A Few TOP3β Phylogenic Trees
The three trees below were made through an online program called Clustal Omega. The FASTA sequences for the proteins of each organism were entered all at once. Once these sequences are entered and aligned, there are numerous ways to construct a phylogenentic tree. The first tree was created using the Percent Identity method based on average distance. The Percent Identity (PID) is the number of identical amino acids per 100 amino acids [2]. Average Distance and Neighbor Joining are two slightly different distance based methods of tree construction. Here, distance refers to the degree of difference between sequences [3]. The Average Distance method compares the homologous sequences in a pair-wise manner and creates a rooted tree, meaning that all the organisms branch from a common ancestor, or a root. the Neighbor Joining method compares homologous sequences as well, but instead creates an unrooted tree, meaning the organisms do not branch out from a common ancestor [4,3]. This method creates the shortest branch length possible [2]. The third tree pictured here was created with the Neighbor Joining method using BLOSUM62 instead of PID. BLOSUM (BLock SUbstitution Matrix) 62 is based on a likelihood method, meaning that it looks for patterns of sequence similarity and then estimates the occurrence of each amino acid at each position. Amino Acids that are more likely to be found in that position are given a higher likelihood score. These positional scores are added together for each sequence to create the tree [5]. The 62 part of BLOSUM62 means that all of the sequence patterns compared shared at least 62% amino acid identity [5].
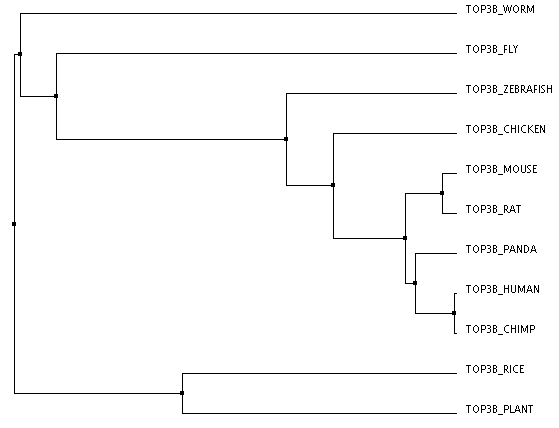
Clustal Omega: Average Distance using % Identity (click image to enlarge)
|
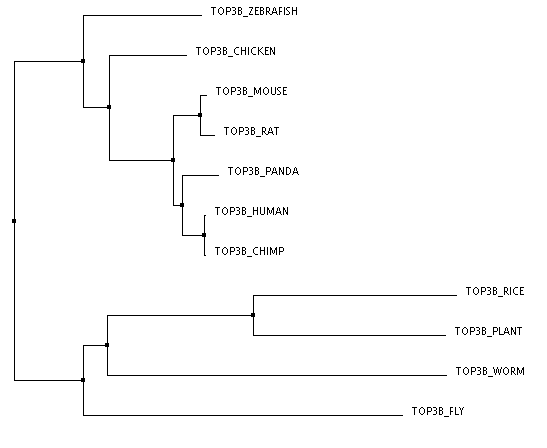
Clustal Omega: Neighbor Joining using % Identity (click image to enlarge)
|
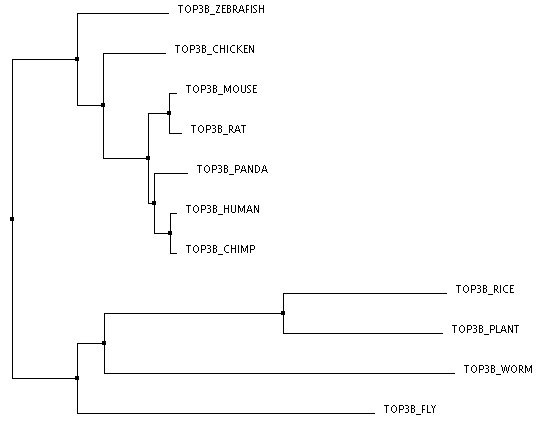
Clustal Omega: Neighbor Joining using BLOSUM62 (click image to enlarge)
|
Analysis of These TOP3β Trees
The second and third trees are identical, which could make sense because they were both made using the Neighbor Joining method. However, I do think that the first tree makes more sense logically and perhaps is more accurate. In all three the human protein is most closely linked to the chimpanzee protein and then the giant panda, which is logical given chimps are our closest ancestors of all of these organisms and all three are large mammals. All three also have the mouse and rat as well as the arabidopsis (plant) and rice most closely related respectively, which makes sense. The rat and mouse are also closest to the human, chimp, and giant panda. This makes sense as they are the only mammals left among the organisms making up the tree. However, the Neighbor Joining trees have the worm and fly more closely related to the plant species than the other animal species. This seems unlikely to me. The Average Distance method has the chicken, zebrafish, fly, and worm all clustered with the animal branches. While it could be argued that the worm and fly are grouped with the plants because they, unlike all the other animals are invertebrates, it still seems more logical that they would be more closely related to other organisms within the animal kingdom.
References
[example tree] http://membercentral.aaas.org/blogs/scientia/problem-protists
[1] What is phylogenetics? Created Jan. 2001. Retrieved Feb. 2014. http://www.cs.tau.ac.il/~rshamir/algmb/00/scribe00/html/lec08/node2.html
[2] Calculations of trees from alignment. Retrieved Feb. 2014. http://www.jalview.org/help/html/calculations/tree.html
[3] Chuang Peng. Distance based methods in phylogenetic tree construction. Morehouse College Department of Math. Retrieved Feb. 2014. http://biochem218.stanford.edu/Projects%202007/Peng1.pdf
[4] Irit Orr. Introduction to Phylogenetic Analysis. Retrieved Feb 2014. http://bip.weizmann.ac.il/education/course/introbioinfo/03/lect12/phylogenetics.pdf
[5] Chuck Staben. BLOSUM 62 Substitution Matrix. Created Sept. 1998. Retrieved Feb. 2014. http://www.uky.edu/Classes/BIO/520/BIO520WWW/blosum62.htm
